
Habitat Suitability Analysis
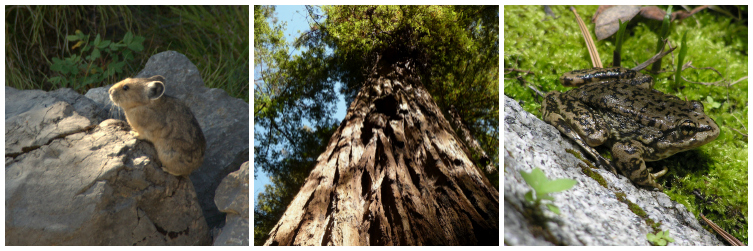
Students taking Environmental Mapping and Analysis (ES 289) in Fall 2012 were given a challenging task -- use information about species occurrences as well as environmental variables to determine the species’ probable future habitat given climate change forecasts. This type of high-level work is usually only undertaken by professional ecologists, but the students were able to use their newly acquired Geographic Information Systems (GIS) skills to create simplified predictive models. Each student chose one of three species: the Southern Mountain Yellow Legged Frog (Rana muscosa), Redwood (Sequoia sempervirens), or American Pica (Ochotona princeps). These species were chosen because they are sensitive and/or iconic in the western United States.
First, students used species occurrence data--recorded observations of where these species occur--from the Global Biodiversity Information Facility (GBIF) as well as historical climate data from the National Center for Atmospheric Research (NCAR) in a logistic regression to determine how temperature and precipitation affect habitat suitability for each species.
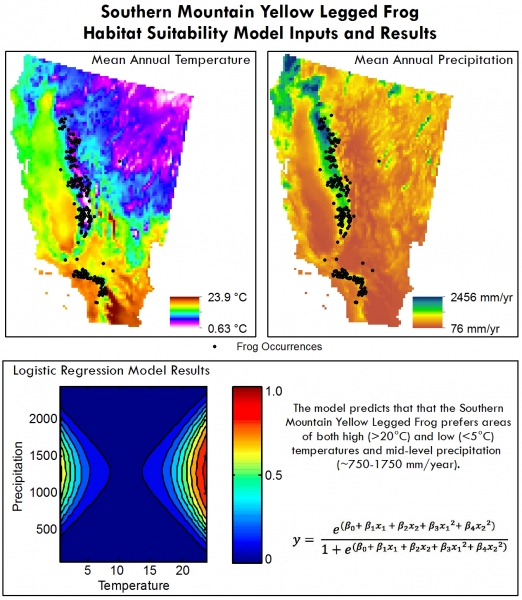
The students then plugged A2 climate scenario data into the model to determine likely future suitable habitat given climate change. The A2 scenario is considered the 'business-as-usual' scenario as it represents how temperature and precipitation should change over the next century given little change in human behavior. Students found that the simple temperature-precipitation model predicted significant changes in suitable habitat for the species based on the climate change forecast. In particular, the models suggested that the suitable habitat for redwoods would shift north, frog habitat would expand in mountainous regions, while stuiable pica habitat would decrease dramatically.

Once the students ran the models and visualized the results in GIS, they created maps for a research poster and synthesized the results in an abstract. They also explained the potential weaknesses and limitations of the project, and commented on how the analysis could have been improved. This project allowed students to apply their technical GIS skills to a relevant and pressing problem, while facilitating critical thinking about analysis methods and results. This ensured that the students moved beyond simple ‘button-pushing’ and began to think critically about data, methods, and results.
Faculty: Alden Griffith, Carolin Ferwerda
LTS Staff: Carolin Ferwerda
Keywords: Geographic Information Systems, Environmental Studies, Quantitative Analysis
Image citations: havankevin; Cary Bass; USFS Region 5